In 2024 there were 22 out of 27 European Union member states with an official minimum wage set by the government.
Turns out this is already the tenth (#10) article about minimum wages in European Union featured on the blog. To keep it up, here is the raw data for minimum wages across European Union in 2024.
Please don't judge too hard, data are taken from this article on Wikipedia, and applied some basic calculations for yearly growth.
It should be noted: The calculations are based on the assumption of a 40-hour working week and a 52-week year, with the exceptions of France (35 hours), Belgium (38 hours), Ireland (39 hours), and Germany (39.1 hours). Most the minimum wages are fixed at a monthly rate, but there are countries where the minimum wage is fixed at an hourly rate or weekly rate.
This review provides a comprehensive overview of the changes in gross minimum wages across various European countries from 2022 to 2024. Here are some key observations:
Luxembourg: Witnessed a significant increase of €368.93, marking a substantial growth of 16.75%.
Netherlands: Experienced a notable rise of €599.00, indicating a substantial increase of 35.21%.
Germany: Demonstrated a moderate increase of €175.00, reflecting a growth rate of 8.86%.
Ireland: Saw a considerable increase of €371.30, representing a growth rate of 20.92%.
Belgium: Experienced a significant increase of €368.18, reflecting a growth rate of 22.64%.
France: Witnessed a modest increase of €121.92, indicating a growth rate of 7.41%.
Spain: Demonstrated a notable increase of €157.00, representing a growth rate of 13.46%.
Slovenia: Experienced a substantial increase of €178.93, marking a growth rate of 16.65%.
Poland: Saw a significant increase of €316.00, reflecting a notable growth rate of 48.24%.
Portugal: Witnessed a considerable increase of €134.66, indicating a growth rate of 16.38%.
Overall, the average minimum wage across the European Union increased by €190.04, representing an average growth rate of 18.53%. These figures underscore the dynamic nature of wage trends within the European labor market and highlight the varying degrees of economic growth and policy changes across different member states.
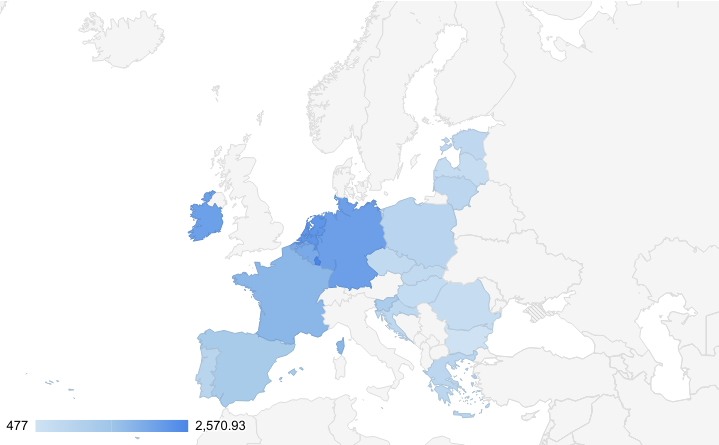
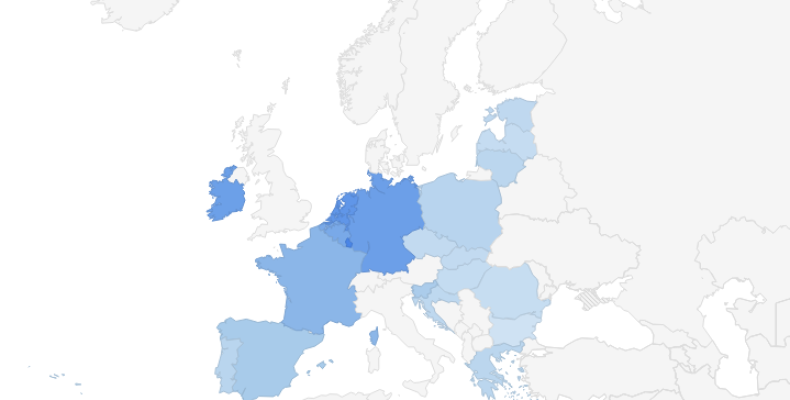
When visualizing data on the map, its' clearly visible that higher minimum wages are set in the Western European countries, despite the higher growth rates are found in Eastern European countries.
I find these data useful as right now I'm growing TerraMatris crypto hedge fund from scratch and minimum wage in EU seems one of the benchmarks to look at when growing our fund in monthly terms, as of writing this article we are targeting about $10.1/daily, that wouldn't get us even a lowest minimum wage in EU yet. We would need at to target at least $17.26/daily to have a minimum wage in Romania.
I hope next time I'm going to make an article about minimum wages in EU for 2025, our monthly income from the fund will increase to at least average minimum wage in EU.
How about you? How do you interpret this data? Are you a person receiving minimum wage in one of the mentioned countries above? Leave a comment, readers and I would love to hear!