For the past couple of days, I've been testing Trality crypto trading bot, executing a few trades. I must say - I feel very impressed with what this bot can do, if you are new to Trality, see my brief review here: Simple Crypto Trading Bot From Trality
As I like testing and implementing ideas, in today's article I'm going to talk about the Relative Strength Index (RSI) and its usage in crypto trades. I believe RSI is one of the easiest ways to trade crypto. Not 100% proof, but a good starting point for sure. In fact, this is the one and only I understand the most.
Disclosure: I'm not a financial advisor and I don't give you any advice, I'm just sharing my own experience. Investments in stocks, funds, bonds, or cryptos are risk investments and you could lose some or all of your money. Do your due diligence before investing in any kind of asset.
The relative strength index (RSI) is a momentum indicator developed by noted technical analyst Welles Wilder, that compares the magnitude of recent gains and losses over a specified time period to measure speed and change of price movements of a security. It is primarily used to attempt to identify overbought or oversold conditions in the trading of an asset.
Backtesting XLM-EUR
I decided to build my trading universe with one coin only, in the normal circumstances I would probably take BTC or ETH, but this time I wanted to take another approach and went with an altcoin - XLM or Stellar Lumens
Here are my strategy settings:
- Action: BUY RSI Candle size 1h, oversold 38
- Action: SELL RSI Candle size 1h, overbought 45
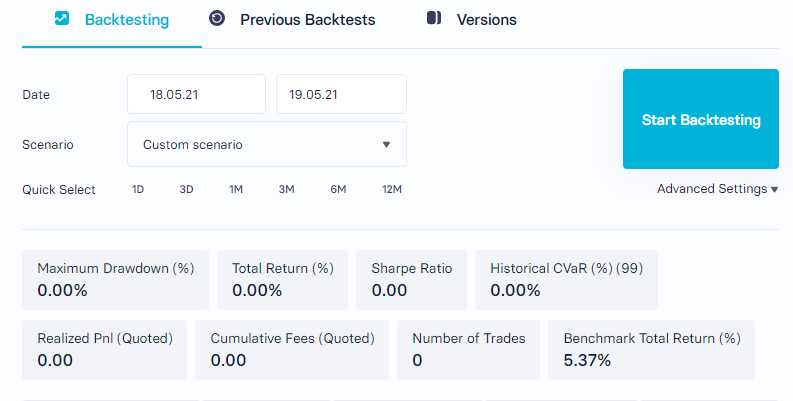
Let's start backtesting for the last 24 hours (1d)
Bactesting XLM-EUR RSI strategy 24 hours
There were no trades done in the last 24 hours, which is fair I guess. Bot just needs more time
Let's try backtesting with the pat 3 days
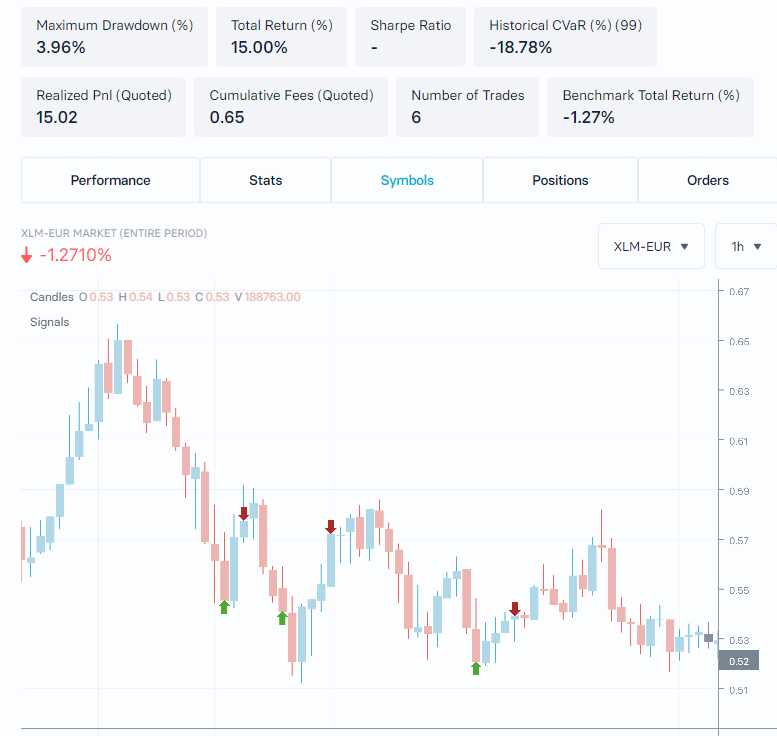
Backtesting XLM-EUR RSI strategy 3 days
Now, this is quite awesome, we were able to generate 15% return in just 3 days, while buy and hold was losing -1.27% meantime
Let's have data for the past 7 days
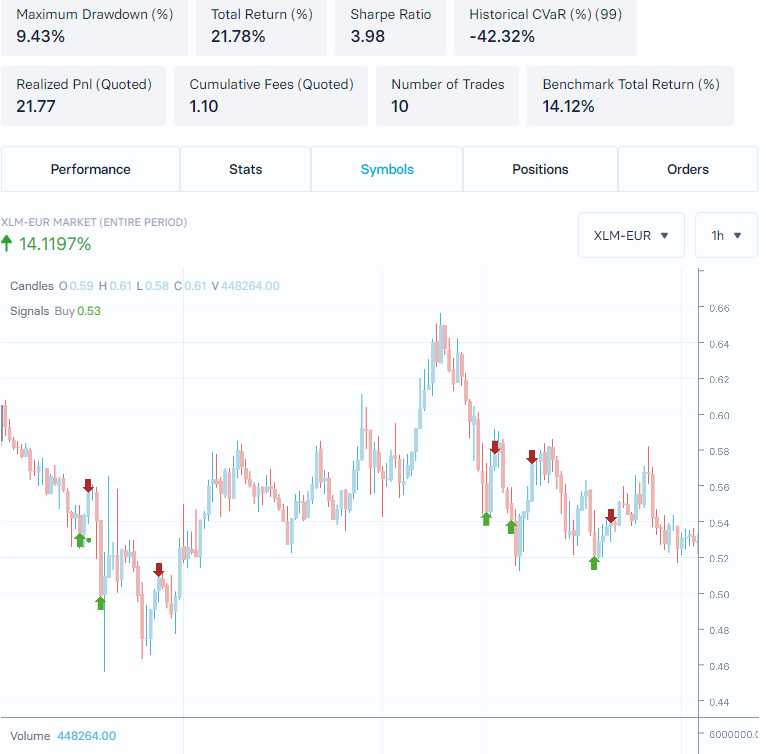
Backtesting XLM-EUR RSI strategy 7 days
Also, quite impressive. 10 trades in 7 days with 21% return, while Buy and Hold having 14.12%.
Look at the entry points, bot have missed a good part from the chart, but I still like it
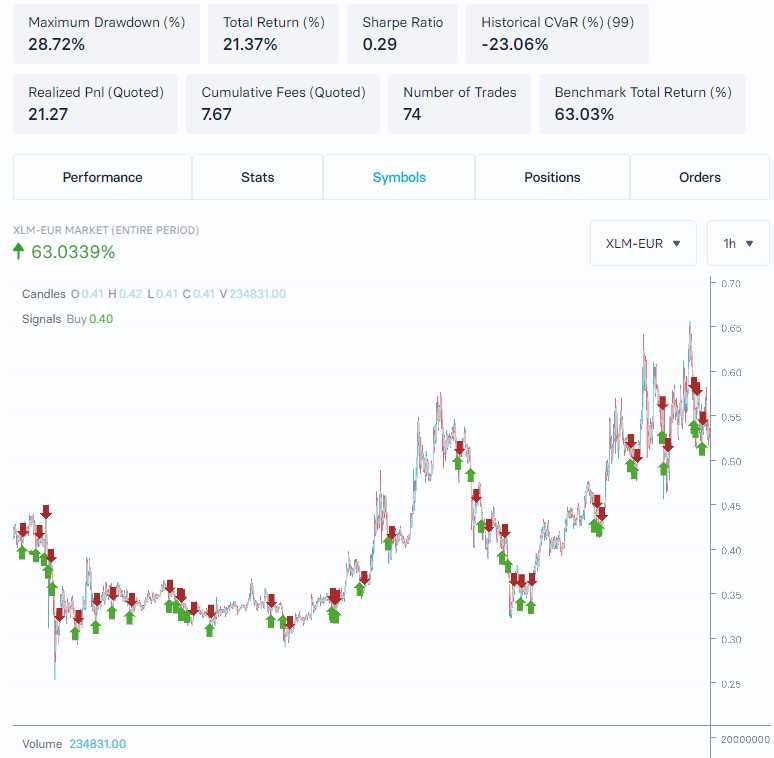
Lets push for 30 days
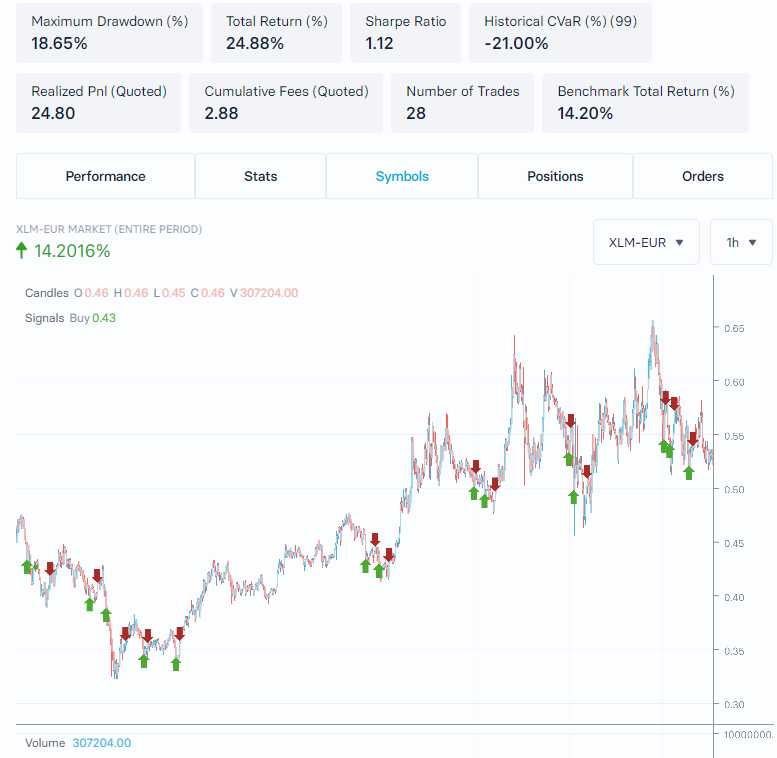
Backtesting XLM-EUR RSI strategy 30 days
Bot just keeps nailing it. If I were investing 100 EUR one month ago, I would made a nice 24.88 EUR profit in 30 days. That again beats the buy and hold (14.20%)\
How about 3m backtesting?
Backtesting XLM-EUR RSI strategy 3 month
Ok, here buy and hold beats bot, and beats it quite impressive
How about 6-month backtesting?
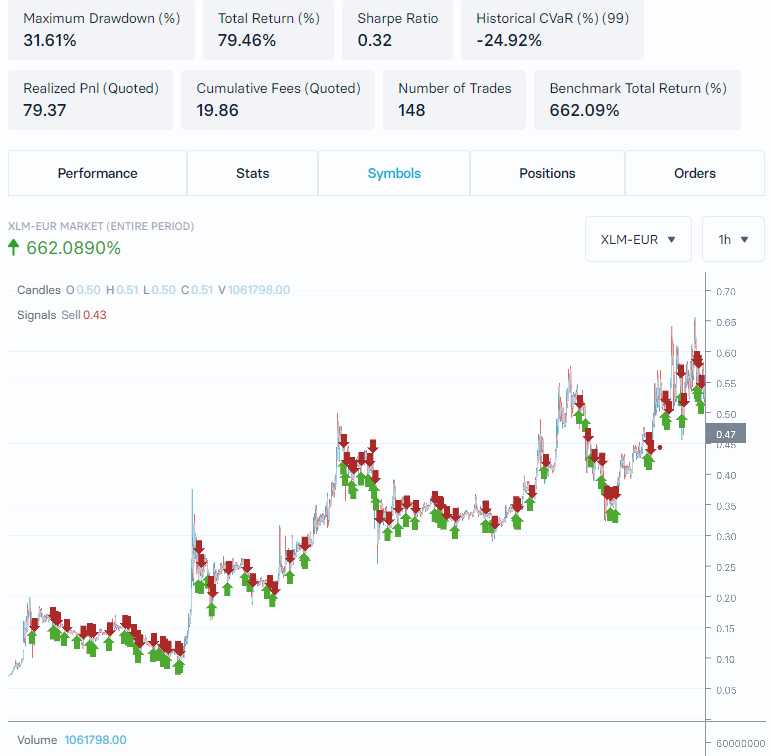
Backtesting XLM-EUR RSI strategy 6 month
I guess no bot can beat 662% return in just 6 months. though I believe with some little tuning we could drastically improve bots' performance too.
Now let's push it harder and check the last 12 months (1 year)
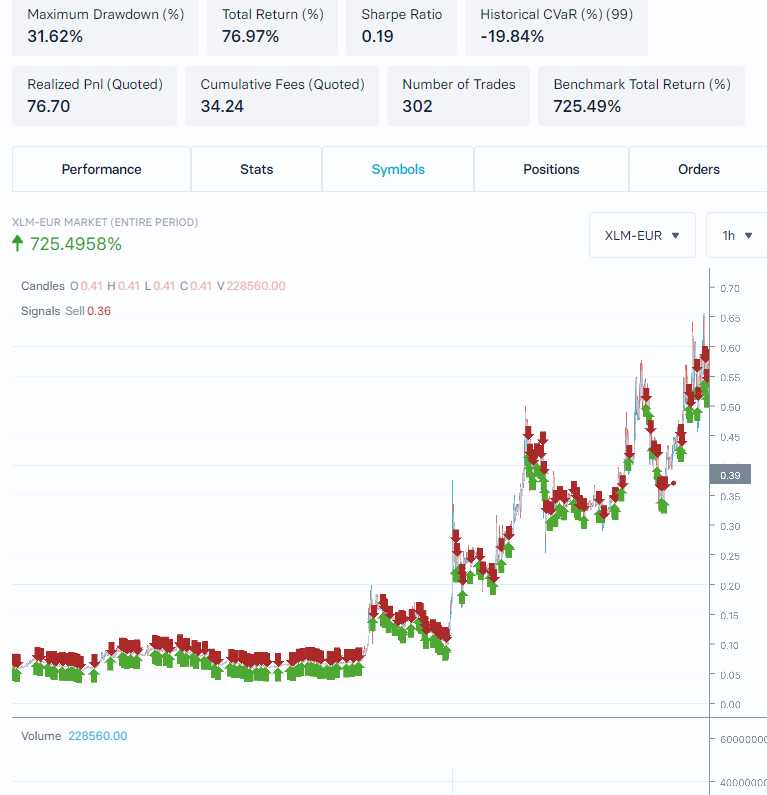
Backtesting XLM-EUR RSI strategy 12 month
76% annual yield looks pathetic compared to the 725% yield buy just holding the assets
What do all these data tell us?
- in all scenarios bot was profitable
- bot showed better trading results in 30 days and started lagging behind in 3 months
- the bot was not able to catch spikes, it missed them in most cases
What shall we do next?
I guess it would be smart to start to investigate what happened with 3 month data and play with settings (change oversold, overbought values), also different candle size levels should change performance.
Here I adjusted RSI values a bit:
- Action: BUY RSI Candle size 1h, oversold 33
- Action: SELL RSI Candle size 1h, overbought 50
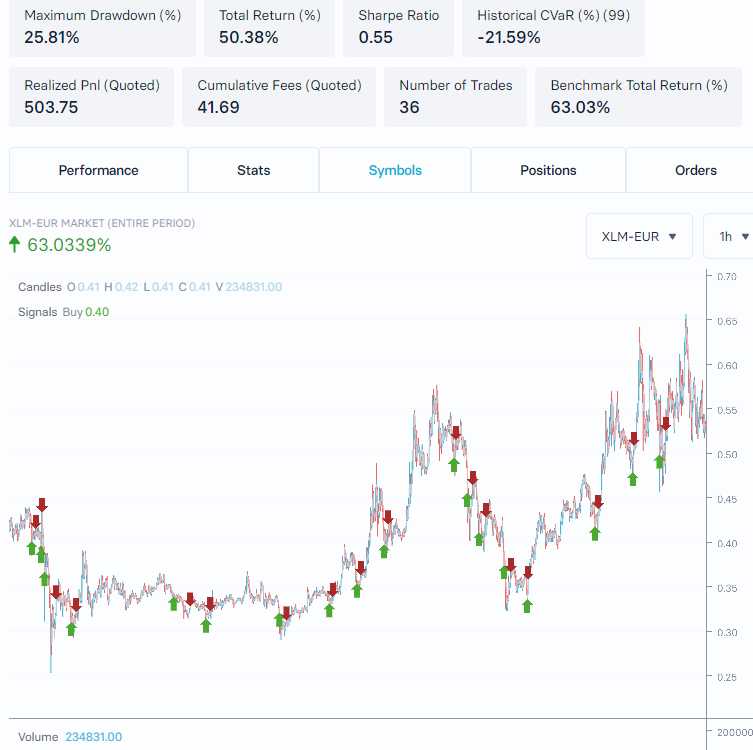
Adjusting RSI to improve performance
With a little tweaking algorithm helped to increase yield to 50% while cutting trades by half. Quite impressive.
I also helped to increase profit to 112% for 6-month trading.
The more i tested I realize, the test is pretty viable for up to 3 month trading period, and thats why i decided i will stick with my initial settings and will let this bot run for the next 30 days.
In Conclusion
Backtesting shows some great results, but there is one huge BUT - the market was pretty bullish for the last 12 months, and more testing should be done to understand how algorithm will react in down trending market conditions.
I;ve connected this bot wth my Coinbase Pro Account and ready to experiment with above listed RSI settings for the next 30 days! I'll keep you posted.