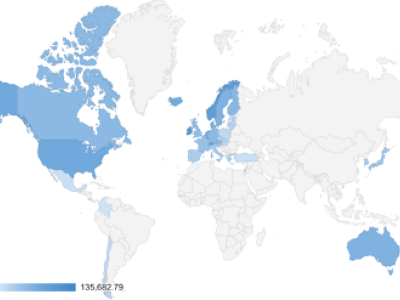
The European Union (EU) is a political and economic union of 27 member states that are located primarily in Europe. The union has a total population of about 447 million.
The other morning I was talking to a friend from South Africa, after a nice conversation about living in Georgia, railways, copper, and African Union I decided to look back on my old articles about African Union and GDP data from there.
After a few hours of research, I come up with a newly updated article and was quite surprised to see a decline in GDP per capita in many of the African economies.
Now I decided to take a fresh look at data about GDP per capita in European Union
Many years ago I did an article about GDP Per Capita in European Union 2013.
Without further ado, here is the raw data:
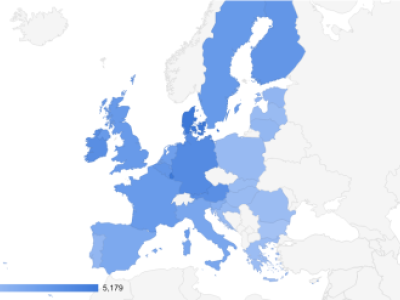
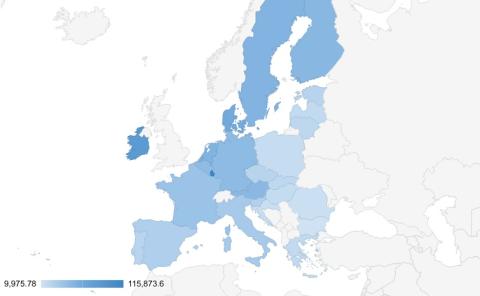
GDP per Capita in European Union 2022 vs 2013
| 2022 | 2013 | Change $ | Growth % | |
| Luxembourg | $115,873.60 | $111,162.00 | $4,711.60 | 4.24% |
| Ireland | $83,812.80 | $47,400.00 | $36,412.80 | 76.82% |
| Denmark | $60,908.84 | $58,930.00 | $1,978.84 | 3.36% |
| Netherlands | $52,304.06 | $47,617.00 | $4,687.06 | 9.84% |
| Sweden | $51,925.71 | $58,164.00 | -$6,238.29 | -10.73% |
| Finland | $49,041.34 | $47,219.00 | $1,822.34 | 3.86% |
| Austria | $48,105.36 | $49,074.00 | -$968.64 | -1.97% |
| Germany | $45,723.64 | $45,085.00 | $638.64 | 1.42% |
| Belgium | $44,594.38 | $45,387.00 | -$792.62 | -1.75% |
| France | $38,625.07 | $41,421.00 | -$2,795.93 | -6.75% |
| Italy | $31,676.20 | $34,619.00 | -$2,942.80 | -8.50% |
| Malta | $27,884.64 | $21,339.00 | $6,545.64 | 30.67% |
| Spain | $27,057.16 | $29,118.00 | -$2,060.84 | -7.08% |
| Cyprus | $26,623.80 | $24,928.00 | $1,695.80 | 6.80% |
| Slovenia | $25,179.67 | $21,816.00 | $3,363.67 | 15.42% |
| Estonia | $23,312.28 | $18,478.00 | $4,834.28 | 26.16% |
| Czech Republic | $22,762.20 | $18,861.00 | $3,901.20 | 20.68% |
| Portugal | $22,439.88 | $21,029.00 | $1,410.88 | 6.71% |
| Lithuania | $19,997.59 | $14,688.00 | $5,309.59 | 36.15% |
| Slovakia | $19,156.89 | $17,045.00 | $2,111.89 | 12.39% |
| Greece | $17,676.19 | $21,910.00 | -$4,233.81 | -19.32% |
| Latvia | $17,619.95 | $14,588.00 | $3,031.95 | 20.78% |
| Hungary | $15,899.15 | $12,698.00 | $3,201.15 | 25.21% |
| Poland | $15,656.18 | $13,432.00 | $2,224.18 | 16.56% |
| Croatia | $13,828.47 | $13,530.00 | $298.47 | 2.21% |
| Romania | $12,896.09 | $9,499.00 | $3,397.09 | 35.76% |
| Bulgaria | $9,975.78 | $7,296.00 | $2,679.78 | 36.73% |
| Average | $34,835.44 | $32,086.41 | $2,749.03 | 8.57% |
Data source: World Bank
As we can see from the Table above, GDP per capita has increased in almost every EU member state, except - Sweden, Austria, Belgium, France, Italy, Spain, and Greece
Of the countries mentioned above, all but Sweden use EUR as their national currency, in the case of drop-in Swedish GDP per capita I could explain related to Sweden's Krona exchange rate to USD.
Austria, Belgium, France, Italy, Spain, and Greece seems to be slowing down. Which might be good for the runner-up countries from the East.
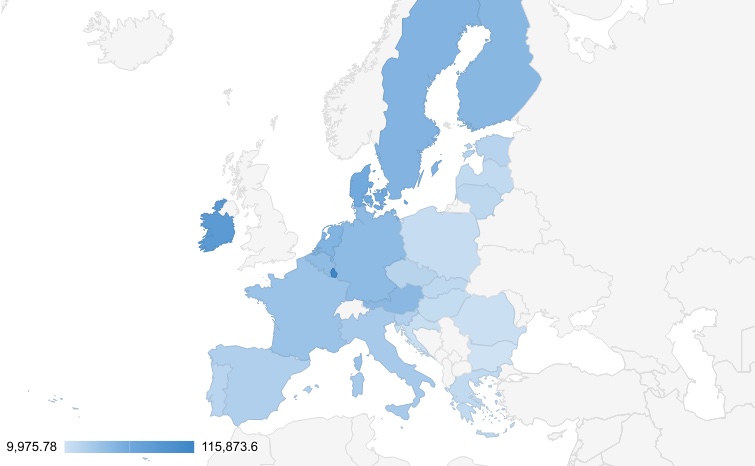
The rest of the EU member states have enjoyed growth, some slower, some greater, with the most of the growth coming from the East
The biggest surprise might be Ireland, which has experienced 76% growth in less than 10 years, growing its GDP per capita well above $80,000.
Here I find a good explanation about Ireland: Multinationals make Ireland’s GDP growth ‘clearly misleading’
Ireland’s GDP is principally distorted by the presence of more than 1,500 multinationals, among them most of the world’s top tech and pharma firms. Ireland is also the world’s top hub for aviation leasing.
Overall GDP per capita in the European Union has raised by an average of 8.57% during the last 9 years and totals $34,835 thousand per capita.
The GDP per capita is clearly growing in the European Union, not in all countries, but the overall growth rate seems healthy.
We might talk about multispeed Europe, with new growth coming from the East and a slowdown in the West. The question is, will the runner-ups will be able to catch up, say in 10-15 years.
What are your thoughts? Leave me a comment, readers and I would love to hear!
*The GDP prices are from 2020, which was not the best for the Worlds economy, but still as the latest data available when publishing this article in June 2022