In 2020 three were 27 member states in the European Union (EU), 19 of the 27 EU member states have adopted the euro (€) as their common currency.
In this article, I've compared the gross monthly average salary for 2020. As I have been writing these articles since 2014, I've left the United Kingdom, just for reference.
Update: Average Monthly Salary in European Union 2022
I wouldn't call the below written scientific research or take it too seriously, as most of the data in this article are taken from Wikipedia's article List of European countries by average wage.
All calculations are done using Google Spreadsheets. The data provided below might not be 100% accurate but they should give an overall insight on average salary levels across European Union member countries.
Countries are ranked by average gross salary in 2020
| 2020 | 2018 | ||||
| Rank | Country | Gross | Gross | Change EUR | Change % |
| 1 | Denmark | €5,179.00 | €5,191.00 | -€12.00 | -0.23% |
| 2 | Luxembourg | €5,143.00 | €4,412.00 | €731.00 | 16.57% |
| 3 | Germany | €4,035.00 | €3,703.00 | €332.00 | 8.97% |
| 4 | Ireland | €3,867.00 | €3,133.00 | €734.00 | 23.43% |
| 5 | Austria | €3,811.00 | €3,632.00 | €179.00 | 4.93% |
| 6 | Belgium | €3,401.00 | €3,401.00 | €0.00 | 0.00% |
| 7 | Finland | €3,380.00 | €3,380.00 | €0.00 | 0.00% |
| 8 | Sweden | €3,194.00 | €3,340.00 | -€146.00 | -4.37% |
| 9 | United Kingdom | €3,161.00 | €2,498.00 | €663.00 | 26.54% |
| 10 | France | €3,097.00 | €2,957.00 | €140.00 | 4.73% |
| 11 | Netherlands | €2,855.00 | €2,855.00 | €0.00 | 0.00% |
| 12 | Italy | €2,442.00 | €2,534.00 | -€92.00 | -3.63% |
| 13 | Spain | €2,279.00 | €2,189.00 | €90.00 | 4.11% |
| 14 | Cyprus | €1,992.00 | €1,779.00 | €213.00 | 11.97% |
| 15 | Slovenia | €1,855.00 | €1,626.00 | €229.00 | 14.08% |
| 16 | Estonia | €1,472.00 | €1,221.00 | €251.00 | 20.56% |
| 17 | Portugal | €1,418.00 | €1,158.00 | €260.00 | 22.45% |
| 18 | Lithuania | €1,381.00 | €885.00 | €496.00 | 56.05% |
| 19 | Malta | €1,379.00 | €1,379.00 | €0.00 | 0.00% |
| 20 | Czechia | €1,280.00 | €1,149.00 | €131.00 | 11.40% |
| 21 | Croatia | €1,214.00 | €1,081.00 | €133.00 | 12.30% |
| 22 | Poland | €1,191.00 | €1,102.00 | €89.00 | 8.08% |
| 23 | Hungary | €1,154.00 | €955.00 | €199.00 | 20.84% |
| 24 | Latvia | €1,152.00 | €1,013.00 | €139.00 | 13.72% |
| 25 | Slovakia | €1,086.00 | €980.00 | €106.00 | 10.82% |
| 26 | Romania | €1,075.00 | €787.00 | €288.00 | 36.59% |
| 27 | Greece | €1,060.00 | €1,092.00 | -€32.00 | -2.93% |
| 28 | Bulgaria | €690.00 | €586.00 | €104.00 | 17.75% |
Data source: List of European countries by average wage
This is a list of countries containing monthly (annual divided by 12 months) gross (before taxes) and net income (after taxes) average wages in Europe in EUR currency.The table above reflects the average (mean) wage as reported by various data providers. In less developed markets, actual incomes may exceed those listed in the table due to the existence of grey economies.

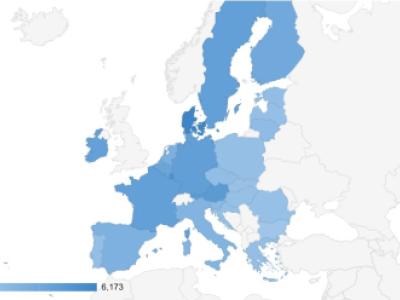
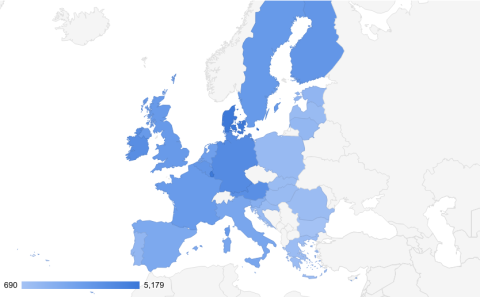
The average salary in the European Union in 2020
The gap (in terms of monthly gross salary) between the richest (Denmark) and the poorest (Bulgaria) is 7.5. Which actually is increasing, as in 2018 the gap between Denmark and Bulgaria was more 7.15 times.
There is one thing that should be kept in mind, not all countries in this list have adopted EUR currency, in fact, there are 8 out of 27 countries in the EU using their national currencies instead of EUR. ( Bulgaria, Croatia, Czechia, Denmark, Hungary, Poland, Romania, Sweden)