This time of the year have come when I'm looking back on previous 2015 year. In today's article I will reveal some data behind the scenes - both traffic and income for whole year of 2015.
If you have been following my blog for a while, you have already probably noticed that once in a month I cover monthly traffic and income reports. Make sure you check them out. This article is a round up posts for previous twelve reports.
This blog has gone a long way and has increased it's monthly visitor count from 19,798 in January to 43,941 users in December. November marked all times best result - more than 50,000 monthly users.
- In total this blog reached 347,035 users in 2015
- In average it is 28,920 monthly users or
- 950 daily visitors
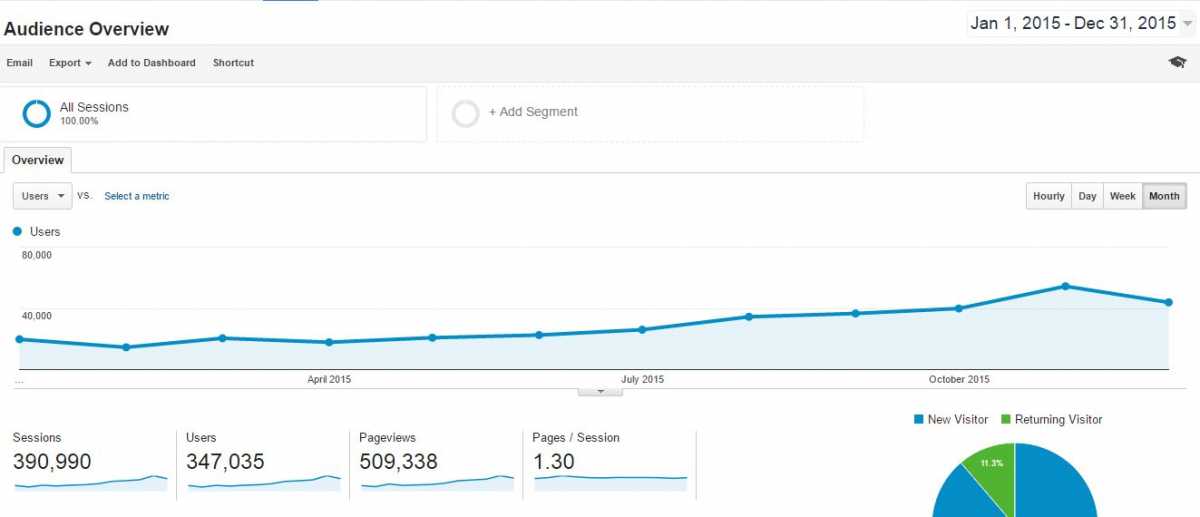
Blog traffic report (monthly view). Data source: Google Analytics
As it happened back in 2014, the biggest traffic gains came in Q3 and Q4, with November making all times best. Page views my blog generated in 2015 reached pretty serious milestone of 0.5 millions
2015 vs 2014
I can proudly report that in 2015 my blog experienced 759% traffic gain if compared to 2014
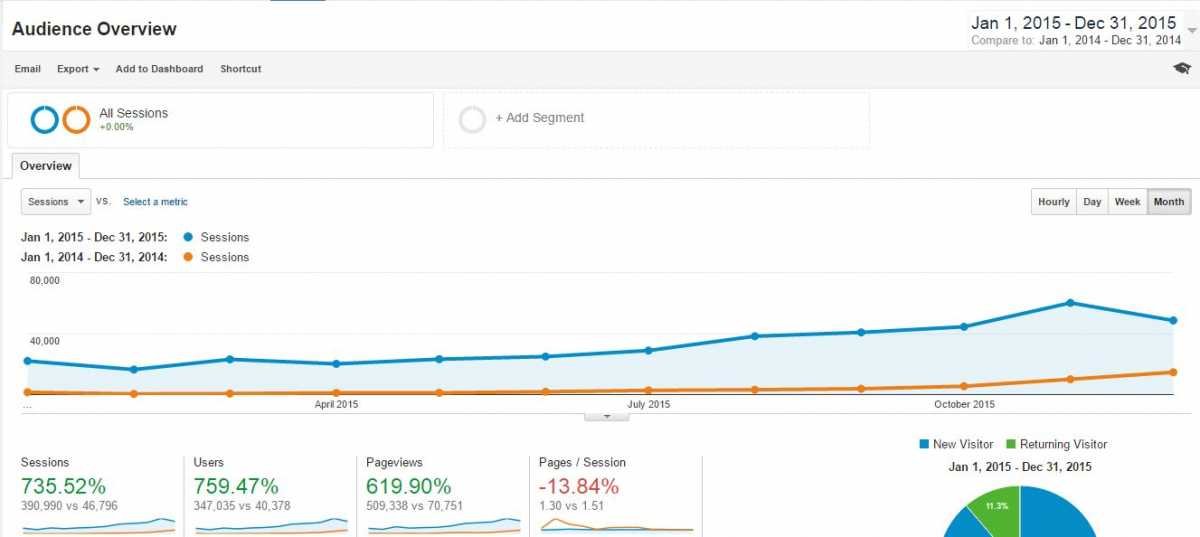
Blog traffic 2015 vs 2014 (monthly view). Data source: Google Analytics
Both sessions and unique users are up by more than 700%, page views are up by more than 600%, but pages per session have decreased by -13.84% from 1.51 in 2014 to 1.30 in 2015. Actually this make me worried a lot, I need to figure out how to increase pages per session in 2016.
Top 10 most popular articles in 2015
In total I have written 479 articles in 2015, on average 1.3 article per day. Back in 2014 I have written in total 428 articles.Here are the top 10 that got the most page views
[view:referenced_items=block_1]
In total those top 10 articles generated 44.82% of total page views on my blog. Pretty impressive number, right?
Mobile device users
The trend mobile vs desktop vs tablet still is a hot topic, I decided to see how many of visitors to my blog use mobile devices:
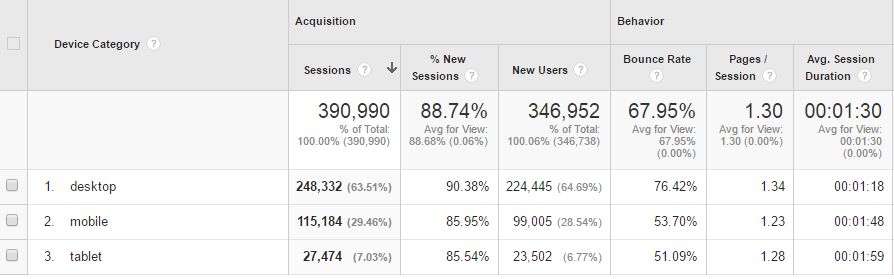
Mobile device users (Data Source: Google Analytics)
As you can see from image above - Desktop users still are the king for my blog making in total 63.51%, followed by mobile devices (29.46%) and tablets (7.03%). But - percentage of desktop users are decreasing, back in 2014, there were 74.09% desktop users and just 19.26% mobile users. In 2015 desktop have lost it position for about 11%, while increased for mobiles (10%) and tablets (1%)
One thing I have noticed here - bounce rates from mobile and tablets are lower than from desktop, and pretty significant lower, the same applies for average time spent on blog.
Demographics: Age and Gender
Using Google Analytics Display features I was able to track down demographics for my blog:
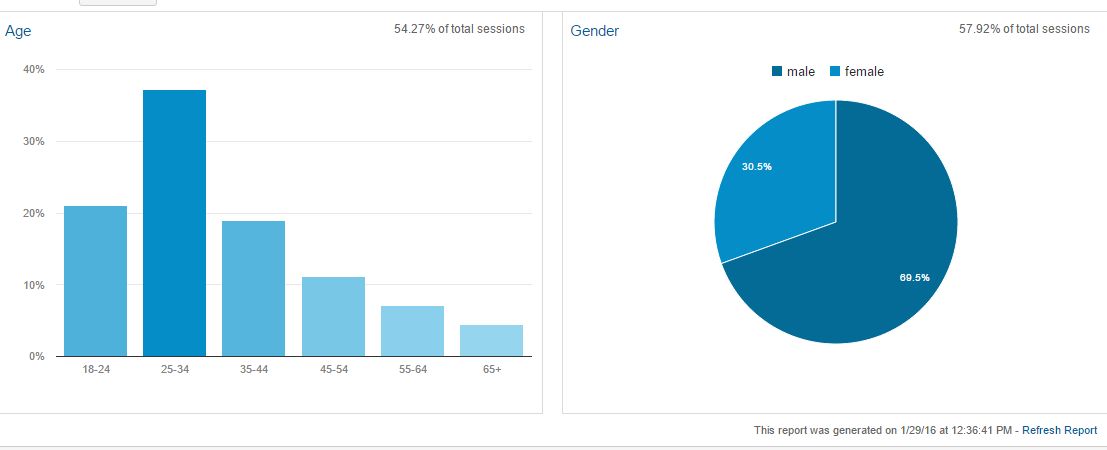
Demographics: Age & Gender (Data source: Google Analytics)
According to Google Analytics my main audience are males (69.5%) in age between 25-34. I'm a male and I'm into this age category as well, so probably it's not a surmise to see your visitors being from the same category?
Demographics: Location
The top 5 haven't changed during this year, but there are some surprises on top 10.
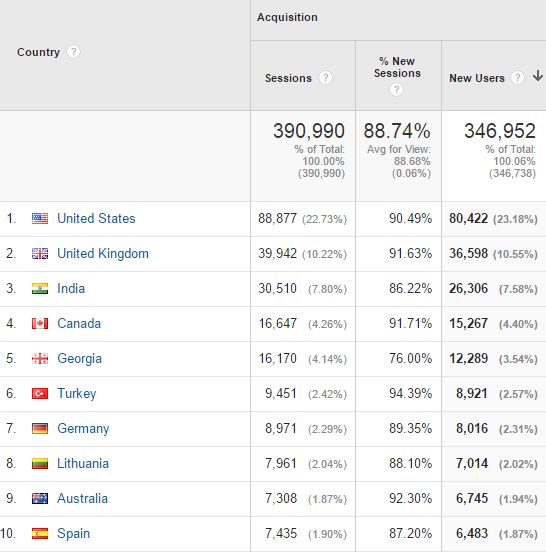
Demographics: Location (Data source: Google Analytics)
- Around 1/4 of my blog traffic are coming from US (22.73%), followed by UK (10.22%) and India (7.80%). Traffic from US if compared to previous year of 2014 has decreased from about 29%, while UK has increased from 8.55% and India from 7.75%.
- Just as back in the 2014, Canada is fourth (4.26%) and Georgia (country I'm living for almost 5 years) comes fifth with 4.14%
- Now there are two countries who made on TOP 10, thanks to the huge traffic surge during the year, at first traffic from Lithuania surged in January giving this country 8th place (2.04%) on top, while traffic from Turkey surged even more, giving it 6th place with 2.42%
- Germany (2.29%) , Australia (1.87%) and Spain(1.90%) also made on top.
Traffic sources
Google still dominates
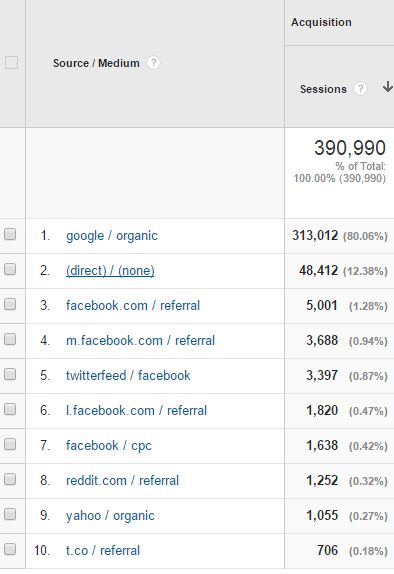
Traffic Sources 2014 (Data Source: Google Analytics)
- Google sent majority of visitors (80.06%)
- Direct traffic, which I believe is a repeat visitors from Google, counts for 12.36%
- Facebook turned out to be the most successful social media site to drive traffic in 2015, desktop and mobile combined sent about 2% of traffic
- My Facebook page, sent about 0.87% of traffic
- Facebook ADS gives 0.42%
- Reddit - 0.32%
- Yahoo - 0,27%
- Twitter - 0.18%
Although its good to have a lot of traffic from Google, 80% seems too high number, I'm willing to decrease dependency on Google in 2016, by using more social media, and first which comes in mind is Facebook, although generated in total (from my Facebook page, social shares and ads) just about 3.8% of overall visits, this seems a channel worth to invest more. I will be happy seeing Facebook accounting for about 10-15% at the end of 2016.
About Blog income in 2015
As stated in the title of this article, my blog earned pretty serious $9,819.71 in 2015, which is a serious gain if compared to 2014 ($3,334.20)
- $9,819.71 is around $818.30 per month or
- $26.90 per day
Here is a breakdown by month:
| Month | Income $ | Expense $ | Net Profit $ | Page views (ths) | RPM ($) |
| January 2015 | 752.65 | 50.85 | 701.8 | 26,826 | 28.05 |
| February 2015 | 940.05 | 40 | 900.05 | 21,467 | 43.79 |
| March 2015 | 619.17 | 67 | 552.17 | 34,373 | 18.01 |
| April 2015 | 733.53 | 371 | 362.53 | 27,636 | 26.54 |
| May 2015 | 433.59 | 60 | 373.59 | 30,147 | 14.38 |
| June 2015 | 662.96 | 62.5 | 600.46 | 31,769 | 20.86 |
| July 2015 | 593.75 | 67.5 | 526.25 | 38,297 | 15.50 |
| August 2015 | 952.59 | 72.5 | 880.09 | 50,213 | 18.97 |
| September 2015 | 951.41 | 697.4 | 254.01 | 53,793 | 17.68 |
| October 2015 | 631.99 | 82.5 | 549.49 | 57,746 | 10.94 |
| November 2015 | 1,022.19 | 55.14 | 967.05 | 74,190 | 13.77 |
| December 2015 | 1,524.09 | 0 | 1,524.09 | 62,879 | 24.23 |
| Total | 9817.97 | 1626.39 | 8191.58 | 509,336 | 19.27 |
- There were only two months in 2015 when income reached more than $1,000 - November and December
- Next best months were - February ($940), August ($952) and September ($951)
- Speaking of the lowest months of the year: May ($433), July ($593)
Speaking of expenses, as you can see from above table in some month they are low, while in some higher, there are even one month in 2015, when I didn't spent a dime. So what makes expenses for this blog, first of all it is hosting, I'm using Linode Virtual Private server to host this blog on, VPS come with price, and for me the price for a very long time was $40 per month, but then I added more resources, like data backups and my current price for Linode VPS is about $62.5 per month. The good news - Linode has its own referral system, where sysadmins can refer new customers using their affiliate link. I have added a few Linode guides and reviews on this blog, and that allowed me to get a free ride on Linode.
Next place where money is spent - Facebook Ads, during 2015 I played a lot with Facebook advertisements to drive traffic to my blog, thus the money spent on Facebook never exceeded more than $20 per month. I'm planing to spend a lot more on Facebook ads in 2016.
Then comes another part, which isn't directly involved in existence of this blog, but without them, this blog wouldn't be as it is now - a new DSRL camera, tripod and a new Asus laptop was the largest purchases last year.
RPM - stands for Reach per Mile or reach per 1000 page views, RPM is term used in advertising to measure efficiency for money spent (ROI) or in my case money earnt. RPM for this blog reached its highest at earning $43.79 per 1000 page views in February. Average RPM $19.27 per 1000 page views in 2015, which I believe is pretty good.
Goals/Forecasts for 2016
Before actually making any goals for 2016, I would like to discuss a little bit of my previous goals for 2015. Back in my 2014 yearly report I set two goals for this year: for traffic and for online income.
Here is what I told about traffic goals a year ago:
Just logically I have some goals to achieve in 2015. I will not be arrogant, and will set my goal pretty modest - to reach in total 150,000 unique visitors in 2015.
Now with about 350,000 unique visitors in 2015 I have more than doubled what I was looking for
About online income:
In total I would like to reach $15,000 by the end of 2015. In average it's $1,250 each month or $41.09 every day. By writing these lines these numbers sounds pretty high for me, but actually I don't think they are impossible.
Now, that didn't happened this year, although I made a pretty impressive almost $10K in 2015, I'm still short of what I was looking for, which leads me to set goals for 2016 more carefully and more modest.
Speaking of them: In 2016 I'm looking to reach 650,000 unique visitors, which makes about 54K in month (I think very doable) and $12,000 in income ($1,000 per month) - hard but doable.