The European Union (EU) is a massive economic force, with a combined GDP that would make it the world's largest economy if it were viewed as a single entity.
However, it is important to remember that the EU is made up of 27 independent member states (as of 20213) each have its own unique economic challenges and strengths.
In this article, we will examine the individual GDPs of each member state in the EU. The GDP of a country is a measure of its economic output and is calculated by adding up the value of all goods and services produced in that country over a specific period of time, usually a year.
It is important to note that the GDP of each EU member state is not necessarily a measure of its overall economic well-being or standard of living. There are other factors to consider, such as income inequality, poverty rates, and access to healthcare and education. However, GDP is still an important metric for assessing the overall economic strength of a country and its role in the global economy.
GDP in European Union 2013
| 2012 $ (bln) | 2013 $ (bln) | Growth $ (mln) | Growth % | % of Total GDP | |
| Germany | 3425.95 | 3634.82 | 208.87 | 6.09 | 20.96 |
| France | 2611.22 | 2734.94 | 123.72 | 4.73 | 15.77 |
| United Kingdom | 2461.76 | 2522.26 | 60.5 | 2.45 | 14.54 |
| Italy | 2013.26 | 2071.3 | 58.04 | 2.88 | 11.94 |
| Spain | 1322.48 | 1358.26 | 35.78 | 2.705522957 | 7.833762243 |
| Netherlands | 770.06 | 800.17 | 30.11 | 3.910084928 | 4.614979116 |
| Sweden | 523.94 | 557.93 | 33.99 | 6.487384052 | 3.217860327 |
| Poland | 490.21 | 517.54 | 27.33 | 5.575161665 | 2.984911071 |
| Belgium | 482.91 | 508.11 | 25.2 | 5.21836367 | 2.930523562 |
| Austria | 394.45 | 415.84 | 21.39 | 5.422740525 | 2.398356494 |
| Denmark | 315.16 | 330.81 | 15.65 | 4.965731692 | 1.907946113 |
| Finland | 247.14 | 256.84 | 9.7 | 3.924900866 | 1.481324264 |
| Greece | 248.42 | 241.72 | -6.7 | -2.697045326 | 1.394119689 |
| Portugal | 212.14 | 219.96 | 7.82 | 3.686244933 | 1.268618926 |
| Ireland | 210.63 | 217.81 | 7.18 | 3.408821156 | 1.256218805 |
| Czech Republic | 196.44 | 198.44 | 2 | 1.018122582 | 1.144502363 |
| Romania | 169.39 | 189.63 | 20.24 | 11.94875731 | 1.093690703 |
| Hungary | 124.6 | 125.94 | 1.34 | 1.075441413 | 0.7263587361 |
| Slovakia | 91.34 | 92.15 | 0.81 | 0.8867965842 | 0.5314749685 |
| Luxembourg | 55.14 | 60.38 | 5.24 | 9.503083061 | 0.3482415474 |
| Croatia | 56.15 | 57.53 | 1.38 | 2.457702582 | 0.3318041773 |
| Bulgaria | 51.3 | 53 | 1.7 | 3.313840156 | 0.30567741 |
| Slovenia | 45.37 | 44.86 | -0.51 | -1.124090809 | 0.2587299738 |
| Lithuania | 42.34 | 43.82 | 1.48 | 3.495512518 | 0.2527317756 |
| Latvia | 28.37 | 29.61 | 1.24 | 4.37081424 | 0.1707756247 |
| Estonia | 22.37 | 24.47 | 2.1 | 9.387572642 | 0.1411306834 |
| Cyprus | 22.76 | 21.46 | -1.3 | -5.711775044 | 0.1237705135 |
| Malta | 8.74 | 8.94 | 0.2 | 2.288329519 | 0.05156143482 |
| 16644.04 | 17338.54 | 694.5 | 4.17266481 | 100 |
Data source World Bank
In 2013 GDP in European Union totalled in $ 17.3 trillions what is 4.17% increase if compared with 2012. Economy of EU now is the largest in world, the US cames second this year with $16.8 trillions.
In 2013 in EU there was 5 economies which was larger that $1 trillion - Germany, France, United Kingdom, Italy and Spain. Their total GDP amounts of about 70% of Total GDP in EU. Well, that's easy to explain, these are most populated countries in EU. In close future, my prediction are as follow - Netherlands and Poland could reach $1 trillion mark, and it could happen in less than 10 years. I strongly believe that.
The rest of 23 European countries have GDP of about 29% of Total GDP, leaving those 23 countries with about $5 trillions to divide between them. And again the lions share of it takes - Netherlands, Sweden and Poland. The rest 20 countries leaves with rest 19%. And so on and so on. To not make this as never ending loop, I will separately divide the smallest economies of EU.
I tried to define a "smallest economy" in EU last year already, then I chose to name a economy small if it's less than $100 bln, but this year I decided to use different approach - I will consider a small those economies which doesn't pass 1% border, now:
There are 11 countries in EU which GDP is less than 1% - Hungary, Slovakia, Luxembourg, Croatia, Bulgaria, Slovenia, Lithuania, Latvia, Estonia, Cyprus and Malta - total GDP in those countries amounts of 3.2% of total EU.
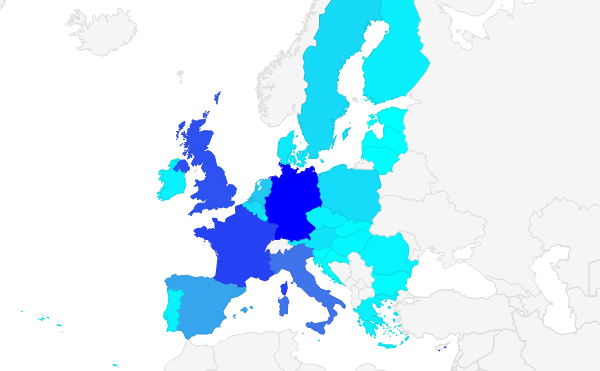
Who has the most money in EU?
As you can see from map above, the least GDP has Eastern Europe, while West has solid GDP. Now taking in account that 2 (Slovenia and Cyprus) out of 3 (Greece) economies who had negative GDP growth, are from so called Small economy club - it makes me think, that small economies are more vulnerable than those who have large economies. And it's obvious - small is dependent from large.
If there is a recession in large economy - it's almost 100% sure, the recession will be in small economies as well. Although, if there will be recession in small economy it will not impact larger economy. So speaking of recessions in Slovenia, Cyprus and Greece (although Greece is not in the Small economy group, it's economy still amounts of modest 1.39% of total EU GDP)- I doubt there is need for panic.
If you are willing to compare GDP per Capita in European Union, you might find interesting this article.
Another interesting observation - EU now is the Worlds largest economy, making me to think, what will be the future of EU. Will EU will go to more brick solid creation? What will be the US next move? EU is worlds largest and China is racing up. Should US needs to start to worry? Aren't they doing that already?