I've been using Google Spreadsheets literally for everything that can be counted or measured (dividend income, stock trades, body weight and so on).
And so did when I decided to build an option trading journal I built it using Google Spreadsheets.
Everything good here, except I decided to count how many trades there have been, how many are open, how many are closed, how many are winning, how many are losing and based on that make a simple calculation to figure out what is my winning rate
Here is the final result:
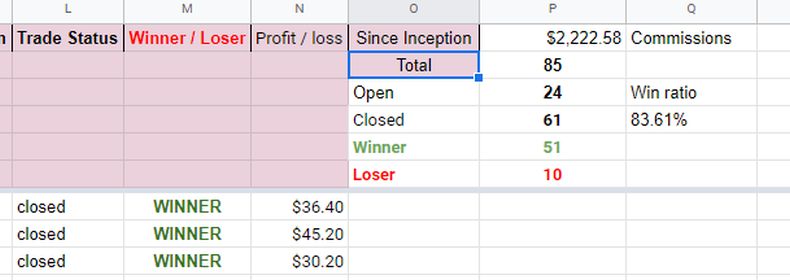
Win ratio calculation using Google Spreadsheets
COUNT DUPLICATES WITH COUNTIF
COUNTIF is a relatively basic Google Sheets function that counts cells that include numbers or text based on a specified condition. The syntax is simple; you only need to provide a cell range and criterion for which cells to count. You can enter the COUNTIF function in the fx bar with the syntax: `=COUNTIF(range, criterion)`. Source: How To Count Duplicates in Google Sheets
Spreadsheet setup
- Column L - Trade status (open/closed)
- Column M - Winner / Loser
Now to make count for open trade status:
=COUNTIF(L:L, "open")
closed:
=COUNTIF(L:L, "closed")
winning trades:
=COUNTIF(M:M, "winner")
losing trades:
=COUNTIF(M:M, "loser")
Works like a charm.