This is a quick tutorial on how to setup / enable charts in Interactive Brokers to trade stocks, ETFs, indexes e.t.c.
For the last couple of months I've been trading 0 DTE SPX, for charting using either Google Finance or Trading view - both are great to get a basic view on what's happening.
Google charts are indeed great to follow up on what's happening, while Tradingview offers some customization, like to add RSI and many other indicators. But as I'm using TWS platform form Interactive Brokers (Lynx Broker) I decided there should be an easier and more native wat to do charting inside the TWS, and there is. I just didn't know about it.
Creating custom charts with Interactive Brokers
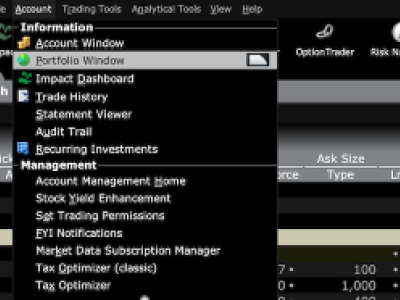
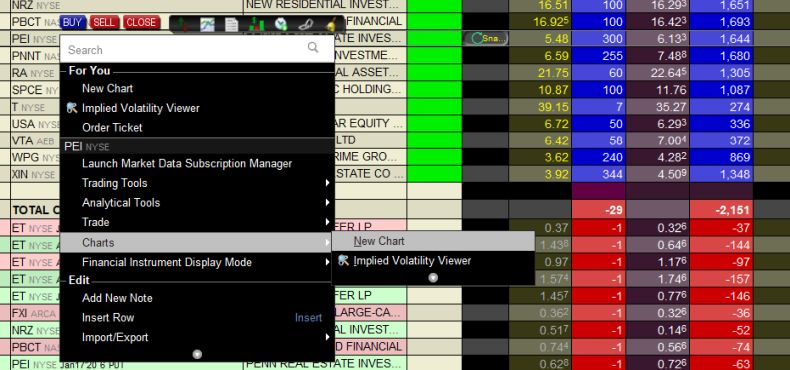
From the portfolio page right-click any of holdings to open the popup menu - chose - Charts -> New Chart
In the next window, you can configure your chart - candle sizes e.t.c
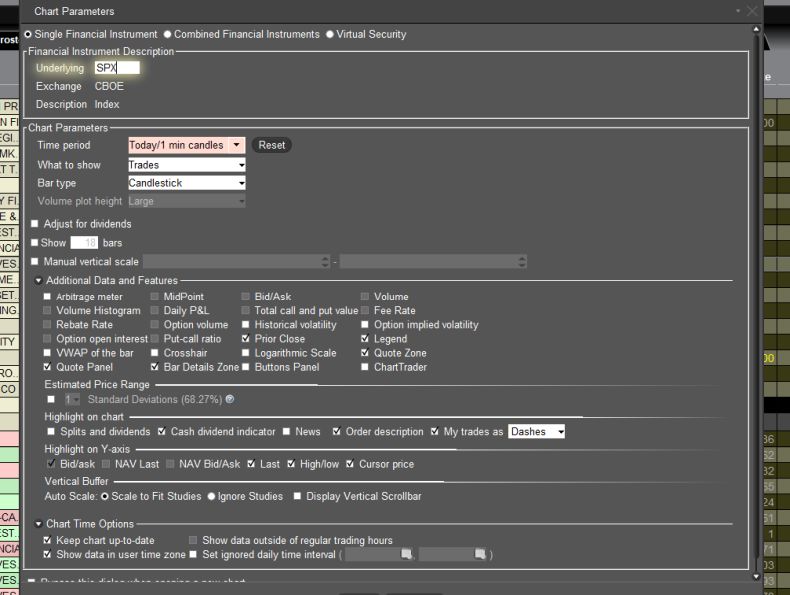
Creating a custom chart with Interactive Brokers
Once you are satisfied, click OK and enjoy your chart
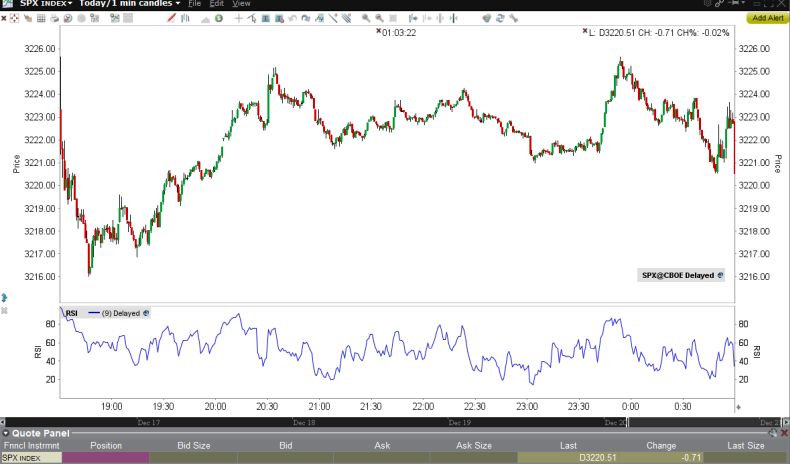
Creating a custom chart with Interactive Brokers
To add RSI or other indicators, from the chart page click on Edit - > Studies to find indicators you are interested in and you should be good.
Trade safe!