My previous post about average salary in European Union for 2014 generated some buzz on social networks (Facebook, Reddit, Twitter) and on other websites, in total it has generated more than 15,000 page views.
I decided to compare how does average salary have changed a year later.
Update: Average Salary in European Union 2018
And I found following; Average median salary has decreased for about -1.3% in European Union in 2015, resulting in EUR 1470 / USD 1631 down from EUR 1489 / USD 1861 in 2014.
The average salary in European Union 2015
| Rank | Country | 2014 | 2015 | ||||
| USD NET | EUR Net | USD NET | EUR NET | Growth (EUR) % | Growth % | ||
| 1 | Luxembourg | 3,986 | 3,189 | 3,495 | 3,149 | -40 | -1.27 |
| 2 | Sweden | 3,362 | 2,690 | 2,831 | 2,551 | -139 | -5.44 |
| 3 | Denmark | 3,902 | 3,122 | 2,560 | 2,307 | -815 | -35.32 |
| 4 | Finland | 2,912 | 2,330 | 2,553 | 2,300 | -30 | -1.3 |
| 5 | United Kingdom | 3,246 | 2,597 | 2,500 | 2,253 | -344 | -15.26 |
| 6 | France | 2,660 | 2,128 | 2,419 | 2,180 | 52 | 2.38 |
| 7 | Netherlands | 2,670 | 2,136 | 2,395 | 2,158 | 22 | 1.01 |
| 8 | Germany | 2,567 | 2,054 | 2,392 | 2,155 | 101 | 4.68 |
| 9 | Ireland | 2,700 | 2,160 | 2,363 | 2,129 | -31 | -1.45 |
| 10 | Austria | 2,642 | 2,114 | 2,357 | 2,124 | 10 | 0.47 |
| 11 | Belgium | 2,432 | 1,946 | 2,321 | 2,091 | 145 | 6.93 |
| 12 | Italy | 2,403 | 1,923 | 2,256 | 2,033 | 110 | 5.41 |
| 13 | Spain | 2,018 | 1,615 | 1,924 | 1,734 | 119 | 6.86 |
| 14 | Cyprus | 2,291 | 1,833 | 1,747 | 1,574 | -259 | -16.45 |
| 15 | Slovenia | 1,305 | 1,044 | 1,212 | 1,092 | 48 | 4.39 |
| 16 | Malta | 1,365 | 1,092 | 1,133 | 1,021 | -71 | -6.95 |
| 17 | Greece | 1,022 | 818 | 1,114 | 1,004 | 186 | 18.52 |
| 18 | Portugal | 1,231 | 985 | 1,111 | 1,001 | 16 | 1.59 |
| 19 | Estonia | 1,051 | 841 | 923 | 832 | -9 | -1.08 |
| 20 | Czech Republic | 876 | 701 | 849 | 765 | 64 | 8.36 |
| 21 | Croatia | 887 | 710 | 815 | 735 | 25 | 3.40 |
| 22 | Poland | 847 | 678 | 782 | 705 | 27 | 3.82 |
| 23 | Slovakia | 853 | 683 | 781 | 704 | 21 | 2.98 |
| 24 | Hungary | 628 | 503 | 713 | 643 | 140 | 21.77 |
| 25 | Latvia | 696 | 557 | 667 | 601 | 44 | 7.32 |
| 26 | Lithuania | 655 | 524 | 603 | 544 | 20 | 3.67 |
| 27 | Romania | 497 | 398 | 462 | 417 | 19 | 4.55 |
| 28 | Bulgaria | 416 | 333 | 395 | 356 | 23 | 6.46 |
| Average | 1,861 | 1,489 | 1631 | 1469 | -19.5 | -1.32 |
Data source: List of European countries by average wage
This is a list of countries containing monthly (annual divided by 12 months) net income (after taxes) average wages in Europe in USD currency and in Euro. Currency exchange rates for 2014 are set to 1 EUR = 1.25 USD, while for the 2015 1 EUR = 1.11 USD (as of July 2, 2015). The table above reflects the average (mean) wage as reported by various data providers. In less developed markets, actual incomes may exceed those listed in the table due to the existence of grey economies.
About average salaries in European Union member countries
While the median average wage in EU is about EUR 1470 / USD 1631 all countries are not equal, so, for example, the largest average salary has been registered in Luxembourg (EUR 3,149) while the lowest in Bulgaria (EUR 356).
According to the table above the largest growth for average salaries have been in Hungary (+21.77%), Greece (18.52%) and Czech Republic (8.36%) - speaking of Hungary and Czech Republic I believe the growth is affected by their national currency exchange rates to Euro, while speaking for Greece - either there is some update on how average salaries are calculated in Greece (probably in my table for 2014 - average wage for Greece was calculated for 14 months instead of 12, either... either ... well taking into account last events on troubled Greece's economy... leave me your suggestion in comments.
There were countries experiencing a huge dip for their average salaries: Denmark (-35.32%), Cyprus (-16.45%) and United Kingdom (-15.26%) - again speaking about Denmark and United Kingdom I can explain this drop with their national currency exchange rates to EUR. Speaking of Cyprus:
The 2012–13 Cypriot financial crisis, part of the wider European debt crisis, has dominated the country's economic affairs in recent times.
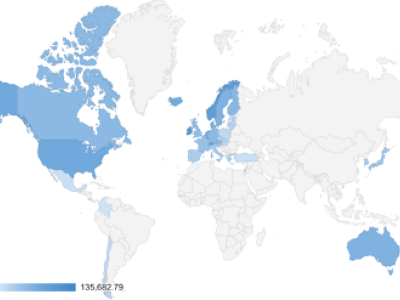
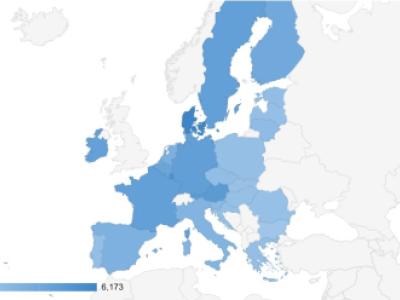
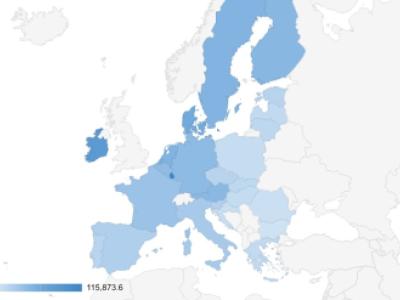
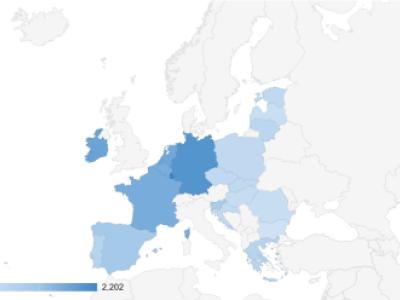
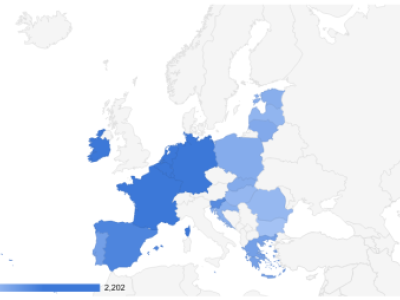
Map
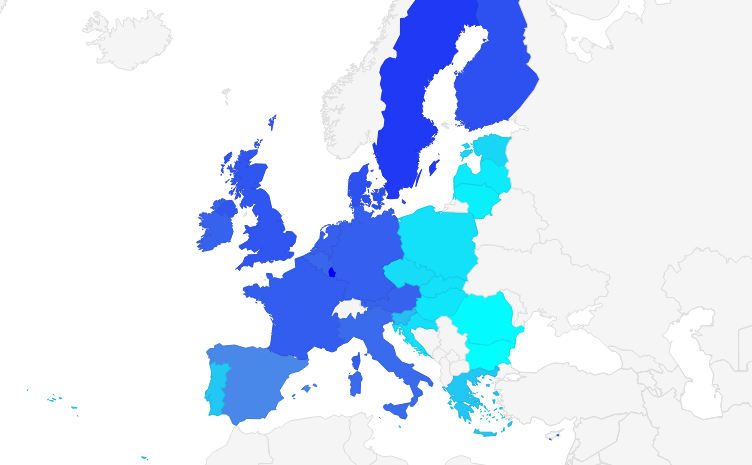
The average salary in European Union