My previous two articles about average salaries in European Union (EU) member countries turned out to be one of the most popular on the blog so far, I would even call them killer articles.
The first post about average salary in EU for 2014 - got more than 85,000 page views; post about average salary in EU 2015 got more than 90,000 page views to the date
Update: Average Salary in European Union 2018
In today's article, I will wrap up latest data on the average salary in EU for 2016.
I wouldn't call this a scientific research, as most of the data in this article are taken from Wikipedia's article List of European countries by average wage. I have added years 2014 and 2015 from previous years and did some simple calculations in Google Sheets. I have listened to previous suggestions to extend the following table with population information for each country to get a better understanding.
2016, definitely is an interesting year for European Union, which will be remembered as the year of Brexit phenomena, when the United Kingdom in referendum decided to leave EU. Anyhow - for this and, most probably next two years data for the United Kingdom will be included in this table, but later on... who knows how things will develop.
The average salary in European Union member countries 2016
Average median salary has increased for about 2.39% in European Union in 2016, resulting in average EUR 1508 monthly up from EUR 1469 in 2015
| Rank | Country | Population | 2014 | 2015 | 2016 | 2015-2016 % | 2014-2016 % |
| EUR Net | EUR NET | ||||||
| 1 | Luxembourg | 0.50 | 3,189 | 3,149 | 3,149 | 0 | -1.27 |
| 2 | Denmark | 5.60 | 3,122 | 2,307 | 3,100 | 25.58 | -0.70 |
| 3 | Sweden | 9.50 | 2,690 | 2,551 | 2,560 | 0.35 | -5.07 |
| 4 | Finland | 5.40 | 2,330 | 2,300 | 2,335 | 1.49 | 0.21 |
| 5 | Germany | 80.60 | 2,054 | 2,155 | 2,225 | 3.14 | 7.68 |
| 6 | France | 66.00 | 2,128 | 2,180 | 2,180 | 0 | 2.38 |
| 7 | Netherlands | 16.80 | 2,136 | 2,158 | 2,158 | 0 | 1.01 |
| 8 | Ireland | 4.60 | 2,160 | 2,129 | 2,129 | 0 | -1.45 |
| 9 | Austria | 8.50 | 2,114 | 2,124 | 2,124 | 0 | 0.47 |
| 10 | United Kingdom | 64.10 | 2,597 | 2,253 | 2,113 | -6.62 | -22.90 |
| 11 | Belgium | 11.20 | 1,946 | 2,091 | 2,091 | 0 | 6.93 |
| 12 | Italy | 59.80 | 1,923 | 2,033 | 2,033 | 0 | 5.41 |
| 13 | Spain | 46.70 | 1,615 | 1,734 | 1,754 | 1.14 | 7.92 |
| 14 | Cyprus | 1.10 | 1,833 | 1,574 | 1,574 | 0 | -16.45 |
| 15 | Slovenia | 2.00 | 1,044 | 1,092 | 1,092 | 0 | 4.39 |
| 16 | Greece | 11.00 | 818 | 1,004 | 1,069 | 6.08 | 23.47 |
| 17 | Malta | 0.40 | 1,092 | 1,021 | 1,021 | 0 | -6.95 |
| 18 | Portugal | 10.40 | 985 | 1,001 | 1,001 | 0 | 1.59 |
| 19 | Estonia | 1.30 | 841 | 832 | 903 | 7.86 | 6.86 |
| 20 | Czech Republic | 10.50 | 701 | 765 | 793 | 3.53 | 11.60 |
| 21 | Croatia | 4.20 | 710 | 735 | 742 | 0.94 | 4.31 |
| 22 | Poland | 38.50 | 678 | 705 | 723 | 2.48 | 6.22 |
| 23 | Slovakia | 5.40 | 683 | 704 | 708 | 0.56 | 3.53 |
| 24 | Latvia | 2.00 | 557 | 601 | 664 | 9.48 | 16.11 |
| 25 | Lithuania | 2.90 | 524 | 544 | 585 | 7.00 | 10.42 |
| 26 | Hungary | 9.80 | 503 | 643 | 570 | -12.80 | 11.75 |
| 27 | Romania | 19.90 | 398 | 417 | 463 | 9.93 | 14.03 |
| 28 | Bulgaria | 7.20 | 333 | 356 | 382 | 6.80 | 12.82 |
| 505.90 | 1,489.43 | 1,469.93 | 1,508.61 | 2.39 | 3.73 |
Data source: List of European countries by average wage
This is a list of countries containing monthly (annual divided by 12 months) net income (after taxes) average wages in Europe in EUR currency. For this year table, I have decided to exclude USD exchange rates, just to keep it simple. The table above reflects the average (mean) wage as reported by various data providers. In less developed markets, actual incomes may exceed those listed in the table due to the existence of grey economies.
While the median average wage in EU is about EUR 1,508 not all countries are equal, so, for example, the largest average salary has been registered in Luxembourg (EUR 3,149) while the lowest in Bulgaria (EUR 382).
It's interesting to observe that the median EUR 1,500 average wage divides EU by half - there are 14 countries where the average wage is above that line, and there are 14 countries where the average salary is below the median. There is roughly 505 million population of EU in 2016. Countries were median average wage is below EUR 1,500 make a population of about 125 million, that's about a 25% of the overall population in EU.
In fact, just four out of fourteen countries where median average salary isbeloww EU average (Slovenia, Greece, Malta and Portugal) have average salary just barely more than EUR 1,000, making the rest from camp 'bellow the median average salary in EU' with even less than EUR 1,000 average monthly salary.

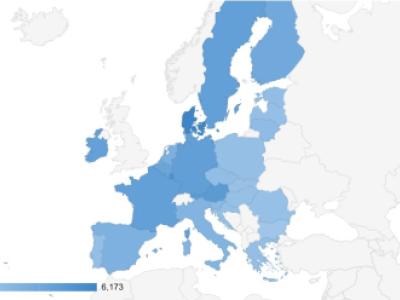
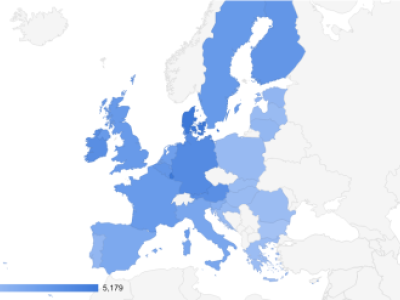
Average salary in European Union 2016
How does your country stands in this table? Readers and me would love to hear! Drop a comment!