Turns out this is already fifth (#5) article about minimum wages in European Union featured on the blog.
Traditions must be continued and here comes the latest article with the latest data for 2018 about minimum wages in the European Union.
Update: Minimum Wages in European Union 2019
In 2018 there were 22 out of 28 European Union member states with the official minimum wage set by the government.
Feel free to browse through the archives for previous years, before proceeding, see:
- What's Minimum Wage in European Union 2017
- Minimum Wages in European Union 2016
- What Is Minimum Wage In European Union 2015
- Minimum Wages in European Union 2014
N.B. Countries that don't have a minimum wage set by the government in European Union - Austria, Denmark, Finland, Cyprus, Italy and Sweden (collective bargaining agreements effective, instead of minimum wage)
For this years article, I was able to pull data both for gross and net minimum wage values across the European Union.
| 2018 | 2017 | Annual Net 2018 | ||||||
| Rank | Country | Gross | NET | Tax | Gross € | Change % | € | $* |
| 1 | Luxembourg | €1,998.59 | €1,687.00 | 15.59% | 1,998.59 | 0.00% | €20,244.00 | $25,102.56 |
| 2 | Netherlands | €1,578.00 | €1,430.00 | 9.38% | 1,551.60 | 1.67% | €17,160.00 | $21,278.40 |
| 3 | Ireland | €1,563.25 | €1,509.00 | 3.47% | 1,563.25 | 0.00% | €18,108.00 | $22,453.92 |
| 4 | Belgium | €1,562.59 | €1,216.00 | 22.18% | 1,531.93 | 1.96% | €14,592.00 | $18,094.08 |
| 5 | France | €1,498.47 | €1,386.00 | 7.51% | 1,480.27 | 1.21% | €16,632.00 | $20,623.68 |
| 6 | Germany | €1,498.00 | €1,102.00 | 26.44% | 1,498.00 | 0.00% | €13,224.00 | $16,397.76 |
| 7 | United Kingdom | €1,395.00 | €1,236.00 | 11.40% | 1,433.82 | -2.78% | €14,832.00 | $18,391.68 |
| 8 | Spain | €859.00 | €733.00 | 14.67% | 825.65 | 3.88% | €8,796.00 | $10,907.04 |
| 9 | Slovenia | €843.00 | €642.00 | 23.84% | 804.96 | 4.51% | €7,704.00 | $9,552.96 |
| 10 | Malta | €747.50 | €571.00 | 23.61% | 735.63 | 1.59% | €6,852.00 | $8,496.48 |
| 11 | Greece | €683.76 | €578.00 | 15.47% | 683.76 | 0.00% | €6,936.00 | $8,600.64 |
| 12 | Portugal | €677.00 | €587.00 | 13.29% | 649.83 | 4.01% | €7,044.00 | $8,734.56 |
| 13 | Poland | €503.00 | €353.00 | 29.82% | 464.60 | 7.63% | €4,236.00 | $5,252.64 |
| 14 | Estonia | €500.00 | €482.00 | 3.60% | 470.00 | 6.00% | €5,784.00 | $7,172.16 |
| 16 | Czech Republic | €480.00 | €408.00 | 15.00% | 407.00 | 15.21% | €4,896.00 | $6,071.04 |
| 15 | Slovakia | €480.00 | €397.00 | 17.29% | 435.00 | 9.38% | €4,764.00 | $5,907.36 |
| 17 | Croatia | €462.00 | €370.00 | 19.91% | 439.33 | 4.91% | €4,440.00 | $5,505.60 |
| 18 | Hungary | €445.00 | €296.00 | 33.48% | 411.00 | 7.64% | €3,552.00 | $4,404.48 |
| 19 | Latvia | €430.00 | €314.00 | 26.98% | 380.00 | 11.63% | €3,768.00 | $4,672.32 |
| 20 | Romania | €409.00 | €251.00 | 38.63% | 321.23 | 21.46% | €3,012.00 | $3,734.88 |
| 21 | Lithuania | €400.00 | €361.00 | 9.75% | 380.00 | 5.00% | €4,332.00 | $5,371.68 |
| 22 | Bulgaria | €261.00 | €202.00 | 22.61% | 235.20 | 9.89% | €2,424.00 | $3,005.76 |
| Average EU | 876.10 | 732.32 | 16.41% | 850.03 | 2.98% | €8,787.82 | $10,896.89 | |
Data source: List of European countries by minimum wage
It should be noted: The calculations are based on the assumption of a 40-hour working week and a 52-week year, with the exceptions of France (35 hours), Belgium (38 hours), United Kingdom (38.1 hours), Ireland (39 hours), and Germany (39.1 hours). Most of the minimum wages are fixed at a monthly rate, but there are countries where the minimum wage is fixed at an hourly rate or weekly rate.
As it already happened for the previous years, there are no changes in the country with highest and lowest minimum wage. Luxembourg as usual ranks #1 with almost EUR 2,000 gross minimum wage in 2018, while Bulgaria ranks last with just EUR 261.00. Making a gap between highest and lowest salary in European Union 7.62 times. That's huge, but shrinking (for 2017, the gap was 8.48 times)
In 2018, there are already three former Communist block countries (Slovenia, Poland, and Estonia) with gross minimum wage set at EUR 500 or higher.

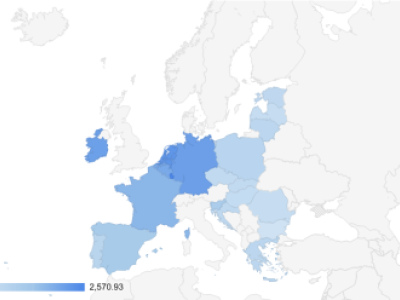
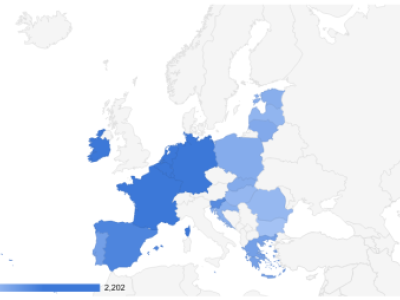
Minimum wage map in European Union 2018
Southern European countries Spain, Greece, and Portugal fall into brackets > EUR 500 and < EUR 1,000 minimum wage in 2018.
The, so called, Western countries - Benelux countries, Germany, France and UK have the highest government set gross minimum wage and are pretty similar.
Last, but not least, by having both values (gross and net) I did a simple calculation to see approximate tax rates in member states.

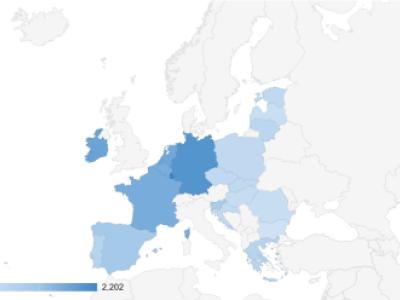
Tax rates for minimum wage in European Union 2018
Now, some interesting data here, it turns out the highest tax rates for minimum wages across the European Union are set in Romania (38.63%), Hungary (33.48%), Poland (29.82%), Latvia (26.98%) and Germany (26.44%)
Most progressive countries are Ireland (3.47%), Estonia (3.60%), France (7.51%), Netherlands (9.38%) and Lithuania (9.75%)