This is already fourth annual article covering minimum wage and its disproportion among 22 of 28 European Union member countries.
Update: Minimum Wages in European Union 2018
Feel free to browse through the archives for previous years, before proceeding, see: 2016, 2015, 2014
In 2017 there were 22 out of 28 European Union member states with official minimum wage set by the government.
N.B. Countries that don't have a minimum wage set by the government in European Union - Austria, Denmark, Finland, Cyprus, Italy and Sweden (collective bargaining agreements effective, instead of minimum wage)
Now, the biggest question about future reports involves Britain after Brexit. As for 2017 United Kingdom still counts in as a member country of EU, in the following table below you will still find data on how much Britons receive in the minimum wage in 2017
Key findings
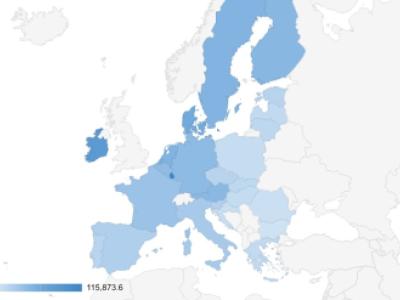
As for the previous years, there are no changes in the country with highest and lowest minimum wage. Luxembourg as usual ranks #1 with almost EUR 2,000 minimum wage in 2017, while Bulgaria ranks last with just EUR 235.50. Making a gap between highest and lowest salary in European Union 8.48 times. That's huge.
All, but Slovenia, former Communist block countries fall below EUR 500 minimum wage in 2017

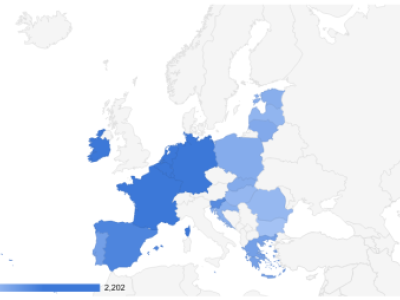
Minimum wage map in European Union 2017
Southern European countries Spain, Greece, and Portugal fall between above EUR 500 and bellow EUR 1,000 minimum wage in 2017. With Greece being the only country which minimum wage has increased just by 0.11% during the last three years (2014-2017).
So-called, Western countries - Benelux countries, Germany, France and UK have more or less similar minimum wage. With Britain experiencing a huge, more than EUR 200 increase, over the last three years, well that, of course, involves British pound strength against euro.
For this year's minimum wage table I've included data for 2014 and current 2017, with added minimum wage growth over three years, to better understand the overall scene. Also, for the first time I've included Forecast for minimum wages in 2020, using last three year growth rate as an indicator.
Data used in this table are from Minimum wages on Eurostat, List of European countries by minimum wage and my previous articles: Minimum wage 2016; Minimum wage 2015; Minimum wage 2014;
Also, it should be noted: The calculations are based on the assumption of a 40-hour working week and a 52-week year, with the exceptions of France (35 hours), Belgium (38 hours), United Kingdom (38.1 hours), Ireland (39 hours), and Germany (39.1 hours). Most of the minimum wages are fixed at a monthly rate, but there are countries where the minimum wage is fixed at an hourly rate or weekly rate.
| 2017 | 2014 | Growth over three years | Forecast | ||||
| Rank | Country | Monthly € | Hourly € | Monthly € | Money € | % | 2020 |
| 1 | Luxembourg | 1,998.59 | 11.53 | 1,921 | 77.59 | 4.04 | 2,079.31 |
| 2 | Ireland | 1,563.25 | 9.25 | 1,461 | 102.25 | 7.00 | 1,672.66 |
| 3 | Netherlands | 1,551.60 | 8.95 | 1,485 | 66.60 | 4.48 | 1,621.19 |
| 4 | Belgium | 1,531.93 | 9.30 | 1,501 | 30.93 | 2.06 | 1,563.50 |
| 5 | Germany | 1,498.00 | 8.84 | 1,473* | 25.00 | 1.70 | 1,523.42 |
| 6 | France | 1,480.27 | 9.76 | 1,455 | 25.27 | 1.74 | 1,505.98 |
| 7 | United Kingdom | 1,433.82 | 8.65 | 1,226 | 207.82 | 16.95 | 1,676.87 |
| 8 | Spain | 825.65 | 4.76 | 752 | 73.65 | 9.79 | 906.51 |
| 9 | Slovenia | 804.96 | 4.64 | 789 | 15.96 | 2.02 | 821.24 |
| 10 | Malta | 735.63 | 4.24 | 702 | 33.63 | 4.79 | 770.87 |
| 11 | Greece | 683.76 | 3.94 | 683 | 0.76 | 0.11 | 684.52 |
| 12 | Portugal | 649.83 | 3.75 | 565 | 84.83 | 15.01 | 747.40 |
| 13 | Estonia | 470.00 | 2.78 | 355 | 115.00 | 32.39 | 622.25 |
| 14 | Poland | 464.60 | 2.71 | 405 | 59.60 | 14.72 | 532.97 |
| 15 | Croatia | 439.33 | 2.55 | 396 | 43.33 | 10.94 | 487.40 |
| 16 | Slovakia | 435.00 | 2.51 | 352 | 83.00 | 23.58 | 537.57 |
| 17 | Hungary | 411.00 | 2.37 | 327 | 84.00 | 25.69 | 516.58 |
| 18 | Czech Republic | 407.00 | 2.44 | 309 | 98.00 | 31.72 | 536.08 |
| 19 | Lithuania | 380.00 | 2.19 | 289 | 91.00 | 31.49 | 499.65 |
| 20 | Latvia | 380.00 | 2.19 | 320 | 60.00 | 18.75 | 451.25 |
| 21 | Romania | 321.23 | 1.83 | 202 | 119.23 | 59.02 | 510.84 |
| 22 | Bulgaria | 235.20 | 1.35 | 173 | 62.20 | 35.95 | 319.76 |
| Average EU | 890.51 | 3.66 | 779.14 | 70.89 | 16.09 | 935.81 | |
* Minimum wage in Germany was introduced in just in 2015, in above table historical data for minimum wage in Germany is used values from 2015.
Exchange rates for hourly minimum wages are set as of 3/21/2017 and might differ for countries with minimum wages set in other currencies than euro.
The average minimum wage for 22 EU member states has increased by about EUR 70 during past three years, from EUR 779.14 in 2014 to EUR 890.51 in 2017. Of course, its just a median indicator as we already know - minimum wages in EU member countries vary.
Also, it's clearly visible that minimum wage growth is relatively much faster in Eastern European countries, with Romania growing it's minimum wage for the past three years almost by 60%, followed by Bulgaria (35.95%) and Estonia (32.39%).
Minimum wage is growing relatively slower in old EU member states, with an exception the United Kingdom. If British Pounds exchanged to Euros, UK shows a very nice about EUR 200 growth for minimum wage in the past three years.